Kaggle Courses
Intro to ML
1
2
3
4
5
6
7
8
9
10
11
12
13
14
15
16
17
18
19
20
21
22
23
24
25
26
27
28
29
30
31
32
33
34
35
36
37
38
39
40
41
42
43
44
45
46
47
48
49
50
51
52
53
54
55
56
57
58
59
import pandas as pddf = pd.read_csv(...) df.describe() df.head() df.tail() df.custom-columns df = df.dropna() y = df.target feature_list = ['col1' , 'col2' , 'col3' ] X = df[feature_list] X.describe() X.head() X.tail() from sklearn.tree import DecisionTreemodel = DecisionTree(random_state=0 ) model.fit(X,y) from sklearn.model_selection import train_test_splitfrom sklearn.metrics import mean_absolute_errorX_train, X_valid, y_train, y_valid = train_test_split(X, y, random_state = 0 ) model = DecisionTree(random_state=0 ) model.fit(X_train, y_train) predictions = model.predict(X_valid) mean_absolute_error(y_valid, X_valid) def get_mae (max_leaf_nodes, X_train, y_train, X_valid, y_valid ): model = DecisionTree(max_leaf_nodes=max_leaf_nodes, random_state=0 ) model.fit(X_train, y_trian) prediction_valid = model.predict(X_valid) return mean_absolute_error(y_valid, prediction_valid) for max_leaf_nodes in [5 , 50 , 500 , 5000 ]: mae = get_mae(max_leaf_nodes, ) print (f"Max leaf nodes: {max_leaf_nodes} \t\t Mean Absolute Error: {mae:.0 f} " ) from sklearn.ensemble import RandomForestRegressormodel = RandomForestRegressor(random_state=0 ) model.fit(X_train, y_trian) prediction_valid = model.predict(X_valid) print (mean_absolute_error(y_valid, prediction_valid))df_test = pd.read_csv(...) X_test = df_test[feature_list] prediction_test = model.predict(X_test) output = pd.DataFrame({'Id' : df_test.Id, 'target' : prediction_test}) output.to_csv('submission.csv' , index=False )
Pandas Course
创建、文件I/O、索引/筛选/访问、统计分析、外部函数、分组/排序、缺值处理、重命名、拼接合并
DataFrame
1
2
3
4
5
6
7
8
9
import pandas as pddf = pd.DataFrame({'Score' : [99 , 21 ], 'Grade' : ['A+' , 'C' ]}) df = pd.DataFrame({'Score' : [99 , 21 ], 'Grade' : ['A+' , 'C' ]}, index = ['Lily' , 'Susan' ]) pd.DataFrame({'Score' : [99 ]}) pd.DataFrame({'Score' : 99 }) pd.DataFrame({'Score' : 99 , 'Grade' :['A+' , 'A+' ]})
Series
1
2
s = pd.Series([1 , 2 , 3 ]) s = pd.Series([99 , 21 ], index=['Lily' , 'Susan' ], name='Score' )
文件数据 I/O
1
2
3
4
df = pd.read_csv("/path/to/csv/file" , index_col=0 ) df.head() df.to_csv("/path/to/save/file" )
数据访问筛选 {col_label:Series},列可通过字典键值访问df[col_label]。符合语法前提下,列标签会被自动转为DateFrame的属性,可由属性操作符访问df.col。当列标签不符合Python变量命名规则,如为数字或含有空格等特殊字符,则无法转为属性。
1 2 3 4 5 df['Score' ] df.Score df['Score' ]['Lily' ] df[:1 ] df[df['Score' ]>60 ]
虽然上述Python/Numpy操作方便直观,但实际代码更推荐使用经专门优化的pandas方法:.at[], .loc[]基于标签进行访问; .iat[], .iloc[]基于数字指标进行访问。iloc[]类似Numpy,上手更方便,loc[]则能利用标签名更清晰的传递代码含义;此外,loc[]支持布尔数组/逻辑判断筛选,而iloc[]不支持。 .isin(), .isnull()
1 2 3 4 5 6 7 8 df.loc['Lily' ] df.loc[:, 'Score' ] df.loc[['Lily' ,'Susan' ], ['Grade' , 'Score' ]] df.loc[df['Score' ]>60 ] df.at['Lily' , 'Score' ] df.iloc[0 ] df.iloc[:, 0 ] df.iat[0 , 0 ]
注:DataFrame标签也支持切片,但不同于数字索引切片,标签切片会同时包含头和尾
1 2 df['Lily' :'Susan' ] df.loc['Lily' :'Susan' ]
赋值
统计分析
1
2
3
4
.describe() .mean() .unique() .value_counts()
自定义函数
1 2 3 4 5 s.map (func-like) df.applymap(func) df.apply(func, axis=0 , args=(), **kwds) df.pipe(func, *args, **kwargs) df.agg(func, axis=0 , *args, **kwargs), df.transform()
分组与排序 df.groupby()分组函数返回的是一个特殊的DataFrameGroupBy对象,其后通常需要跟数据分析操作或应用其他自定义函数操作,并最终返回普通DataFrame或/Series对象。
1 2 3 4 5 6 7 8 df.groupby('Grade' ).count() df.sort_index(axis=0 , ascending=True ) df.sort_values(by, axis=0 , ascending=True )
缺失值处理
1 2 3 4 5 6 7 8 9 10 df.isnull() df.fillna(value=None , method=None , axis=None ) df.dropna(axis=0 , how='any' ) df.replace(to_replace=None , value=None , regex=False )
重命名
1 2 3 4 5 6 7 df.rename(columns={'Score' : 'Points' }) df.rename(index={'Lily' : 'Lucy' })
拼接合并
1 2 3 4 5 6 7 8 9 10 11 12 df_1 = pd.DataFrame({'Id' : [0 , 1 , 2 , 3 , 4 ], 'Score' :[90 , 89 , 40 , 98 , 80 ]}) df_2 = pd.DataFrame({'Id' : [0 , 1 , 2 , 3 , 4 ], 'Grade' :['A' , 'B+' , 'D' , 'A+' , 'B' ]}) df_1.join(df_2, lsuffix='_l' , rsuffix='_r' ) df_1.set_index('Id' ).join(df_2.set_index('Id' )) df_1.join(df_2.set_index('Id' ), on='Id' )
更多pandas操作介绍可参考pandas快速入门 。
数据缺失、类别变量、Pipeline、交叉验证、XGBoost、数据泄露
缺值处理
忽略存在缺失值的列(或行?) 除非缺值过多否则不推荐,会损失有效信息
缺值填充:sklearn.impute SimpleImputer, KNNImputer
标记填充:填充之外追加对应列标记缺值 MissingIndicator
1
2
3
4
5
6
from sklearn.impute import SimpleImputerimputer = SimpleImputer(strategy='median' ) imputer.fit(X) imputer.transform(X) imputer.fit_transform(X) imputer.inverse_transform(X)
注意:sklearn默认是配合Numpy数组的,因此返回值默认是Numpy数组。配合pandas使用时,需手动将返回的Numpy数组转换为DataFrame(标签也需手动加回)。
1
2
3
X_imputed = pd.DataFrame(imputer.transform(X), index = X.index, columns=X.custom-columns)
如果模型未涉及标签引用,则标签不加也无所谓,对结果没影响。但若涉及数据表合并操作,则标签对于数据对齐很关键,需小心处理 。下面示例中使用MissingIndicator进行数据预处理(标记+填充)时,行标签的添加是必须的。
数据预处理流程
1
2
3
4
5
6
7
8
9
10
11
12
13
14
15
16
17
18
19
20
21
22
23
24
25
26
27
28
29
30
31
32
33
34
35
36
37
38
39
40
41
42
43
44
45
46
47
48
49
import pandas as pdfrom sklearn.impute import SimpleImputerfrom sklearn.model_selection import train_test_splitdata = pd.read_csv('../input/train.csv' , index_col='Id' ) data_test = pd.read_csv('../input/test.csv' , index_col='Id' ) data.dropna(axis=0 , subset=['SalePrice' ], inplace=True ) y = data.pop('Price' ) X = data.select_dtypes(exclude=['object' ]) X_test = data_test.select_dtypes(exclude=['object' ]) X_train, X_valid, y_train, y_valid = train_test_split(X, y, \ train_size=0.8 , test_size=0.2 , random_state=0 ) cols_null = X.custom-columns[X.isnull().any ()] X_train_reduced = X_train.drop(columns=cols_null) X_valid_reduced = X_valid.drop(columns=cols_null) X_reduced = X.drop(columns=cols_null) imputer = SimpleImputer(strategy='median' ) X_train_imputed = pd.DataFrame(imputer.fit_transform(X_train)) X_valid_imputed = pd.DataFrame(imputer.transform(X_valid)) X_imputed = pd.DataFrame(imputer.transform(X)) cols_null = X.custom-columns[X.isnull().any ()] X_train_ind = X_train.join(X_train[cols_null].isnull(), rsuffix='_indicator' ) X_valid_ind = X_valid.join(X_valid[cols_null].isnull(), rsuffix='_indicator' ) X_ind = X.join(X[cols_null], rsuffix='_indicator' ) imputer = SimpleImputer(strategy='median' ) X_train_ind_imputed = pd.DataFrame(imputer.fit_transform(X_train_ind)) X_valid_ind_imputed = pd.DataFrame(imputer.transform(X_valid_ind)) X_ind_imputed = pd.DataFrame(imputer.transform(X_ind))
类别数据
忽略类别变量 除非类别变量与目标无关,否则不推荐
序编码(数字编码):sklearn.preprocessing OrdinalEncoder 编码为整数序号
独热编码:用基向量编码类别,可用于名义变量(nominal variables) OneHotEncoder
注1:sklearn中目标值类别(y)的序编码器为LabelEncoder、独热编码器为LabelBinarizer
1
2
3
4
5
6
7
8
9
10
11
12
13
14
15
16
17
18
19
20
21
22
23
from sklearn.preprocessing import OrdinalEncoder, OneHotEncoderencoder = OneHotEncoder(sparse=False , handle_unknown='ignore' ) X_categorical = X.select_dtypes('object' ) cols_low_cardinality = X.custom-columns[(X.dtypes=='object' ) & (X.nunique()<=10 )] X_categorical = X.loc[:, cols_low_cardinality] encoder.fit(X_categorical) encoder.transform(X_categorical) encoder.fit_transform(X_categorical) encoder.inverse_transform(X_categorical) code_categorical = pd.DataFrame(encoder.transform(X_categorical), index = X_categorical.index) X = X.drop(cols_categorical, axis=1 ).join(code_categorical)
问题1 :独热编码中类别数据的每个分类都将作为独立特征(在DataFrame中引入一列),而最终增加的数据条目还要乘以记录数(行数)。因此当某个类别数据的种类/基数(cardinality)特别多时,将引入巨大的稀疏矩阵。相比之下,序编码只是将原数据条目替换为数字,并不增加数据表维度。因此为了避免维度诅咒,对于种类/基数过多的类别,通常会避免独热编码,而采用序编码或直接忽略。问题2 :数据分为训练集、验证集之后,某些特征可能会出现验证集中存在测试集中未包含的类别,导致编码失败。最简单粗暴的做法是忽略这些类别,此时除了像下面手动筛选特征外,还可简单设置编码器参数handle_unknown='ignore'。
1
2
3
4
5
cols_categorical = X.custom-columns[X.dtypes=='object' ] cols_choosen = [col for col in cols_categorical if set (X_valid[col]).issubset(set (X_train[col]))]
问题3 :Pandas也支持方便快捷的独热编码(pd.get_dummies()),但建立机器学习模型时仍推荐使用sklearn,原因就在于问题2,具体可参考这里 ,不过也有一些技巧解决:
1
2
3
4
5
6
7
8
9
10
11
12
13
14
15
16
X_train = pd.get_dummies(X_train) X_valid = pd.get_dummies(X_valid) X_train, X_valid = X_train.align(X_valid, join='left' , axis=1 , fill_value=0 ) df_1 = pd.DataFrame({'Score' : [90 , 89 , 59 , 98 ], 'Grade' : ['A' , 'B+' , 'C' , 'A+' ]}) df_2 = pd.DataFrame({'Score' : [99 , 21 ], 'Grade' : ['A+' , 'D' ]}) df1 = pd.get_dummies(df_1) df2 = pd.get_dummies(df_2) df1, df2 = df1.align(df2, join='left' , axis=1 , fill_value=0 ) cat_types = pd.CategoricalDtype(categories=['A+' , 'A' , 'B+' , 'B' , 'C' ]) df1 = pd.get_dummies(df_1.astype({'Grade' : cat_types})) df2 = pd.get_dummies(df_2.astype({'Grade' : cat_types}))
Pipelines
预处理流程封装(数值数据+类别数据) → 模型定义 → 组装运行fit, predict
基于Pipeline,只需定义预处理所需执行操作(缺值填充、数据编码等),而无需手动执行,训练模型时直接代入原始数据,相关预处理操作会被自动调用执行。
类似的,代入验证集、测试集进行预测时,相关预处理操作同样会自动执行。
Pipeline可使代码更清晰,避免遗漏预处理,也便于后续的模型验证及部署。
sklearn.pipeline :Pipeline(串联), FeatureUnion(并联)sklearn.compose :ColumnTransformer(列选择+并联), TransformedTargetRegressor(y)
Pipeline(steps) 串联多个数据变换操作并最终传递给transformer/estimatorFeatureUnion(transformer_list) 合并(并联)多个数据变换/特征提取操作ColumnTransformer(transformers, remainder='drop') 对指定的数据列执行各自变换TransformedTargetRegressor() 用于回归问题中目标值(y)的非线性变换
管道(Pipeline)、特征联合(FeatureUnion)及列变换(ColumnTransformer)的首个参数均为元组列表,前两者元组为命名加变换,后者多了列筛选参数(name:str, transformer, cols)。transformer除了正常变换(支持fit+transform),还可取'drop'/'passthrough',用于指定要移除或保持原样的特征列;而所有元组的cols参数都未涉及的剩余列的操作由reminder指定,同样可取正常变换, 'drop' 或 'passthrough',默认会被移除('drop')。并联 操作,返回特征的列顺序由列表中变换的顺序决定,不同变换涉及同一数据列,会返回各自独立变换后的特征,而非串联操作。对于需要串联操作的列变换可先用管道封装,再加入列变换。
1
2
3
4
5
6
7
8
9
10
11
12
13
14
15
16
17
18
19
20
21
22
23
24
25
26
27
28
29
30
31
32
33
34
35
from sklearn.pipeline import Pipelinefrom sklearn.compose import ColumnTransformerfrom sklearn.impute import SimpleImputerfrom sklearn.preprocessing import OneHotEncoderfrom sklearn.ensemble import RandomForestRegressorcols_cat = X.custom-columns[(X.dtypes=='object' ) & (X.nunique()<=10 )] cols_num = X.select_dtypes('number' ).custom-columns numerical_transformer = SimpleImputer(strategy='median' ) categorical_transformer = Pipeline(steps=[ ('imputer' , SimpleImputer(strategy='most_frequent' )), ('onehot' , OneHotEncoder(handle_unknown='ignore' )) ]) preprocessor = ColumnTransformer(transformers=[ ('num' , numerical_transformer, cols_num), ('cat' , categorical_transformer, cols_cat) ]) model = RandomForestRegressor(n_estimators=100 , random_state=0 ) pipeline = Pipeline(steps=[ ('preprocessor' , preprocessor), ('model' , model) ]) pipeline.fit(X_train, y) pipeline.predict(X_valid)
交叉验证
1
2
3
4
5
6
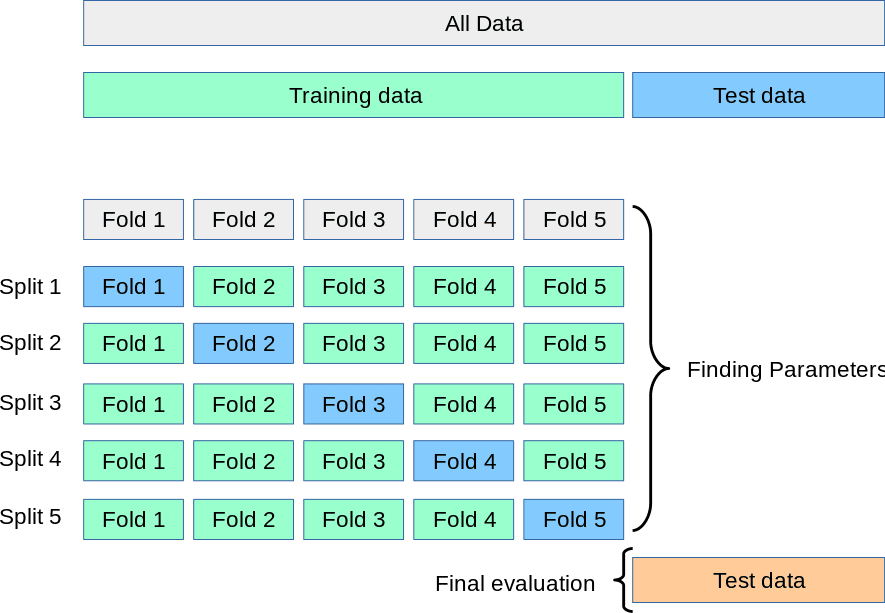
from sklearn.model_selection import cross_val_scorescores = cross_val_score(pipeline, X, y, cv=5 , scoring='neg_mean_absolute_error' ) print ("Average MAE score:" , -scores.mean())
XGBoost
梯度提升(Gradient Boosting) sklearn.ensemble, XGBoost LightGBM CatBoost
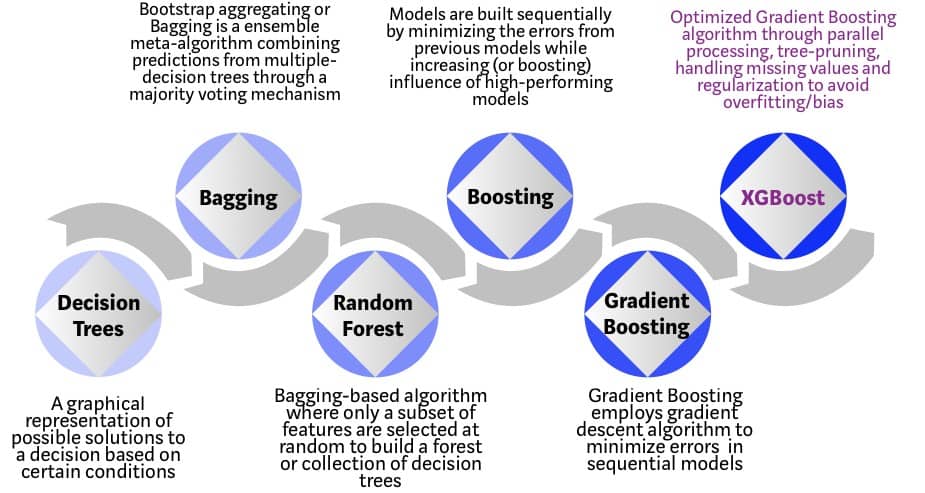
梯度提升属于集成学习方法,后者原理为基于一定策略融合多个小模型,提升模型整体决策鲁棒性或预测精度。其中模型整合策略主要有平均(Averaging)和提升(Boosting)两种:前者即多个模型民主投票,如基于Bagging(Bootstrap Aggregating)的随机森林(RF)算法;后者是指每个模型都建立在前一模型基础之上,迭代提升。Bagging通过平均增强模型鲁棒性(↓variance),而Boosting是迭代优化Loss(↓bias)。还有一个集成策略是在多个模型之上堆叠(Stacking)一个更高层的模型,并将底层模型输出作为输入,用于最终决策。这个视频 ;而“梯度”是指提升时利用梯度下降算法最小化预测的误差。XGBoost、LightGBM、CatBoost属于梯度提升机(GBM)或者说梯度提升决策树(GBDT)的不同实现,后两者主要在速度上有较明显提升,且都可以自动应对分类特征,其中CatBoost更是以处理类别特征而闻名。
1
2
3
4
5
6
7
8
9
10
11
12
from xgboost import XGBRegressormodel = XGBRegressor(n_estimators=100 , learning_rate=0.3 , random_state=0 ) model.fit(X_train, y_train, early_stopping_rounds=5 , eval_set=[(X_valid, y_valid)]) model.predict(X_valid)
数据泄露
目标信息泄露(Target leakage):预测时使用了当下未知的预测目标直接相关信息
训练数据污染(Train-test contamination):训练、测试集划分前就进行了数据预处理
预测癌症时使用抗癌药物服用信息或就诊医院信息属于目标信息泄露,又比如使用普通K折交叉验证检验时序预测模型(有专门的TimeSeriesSplit)。过早特征化属于测试数据泄露,数据划分前就进行特征提取、转换、降维、选择等操作;又或者数据划分前就进行自助采样(bootstrap)或数据增强,致使训练集与测试集包含相同数据或基于同一数据的变换。在模型验证前缺值填充、特征变换等操作的拟合都只能用于训练集,不能包含验证集(及测试集),验证后、测试前可同时拟合训练集+验证集吗???维基百科 中的 group leakage 部分提供了一个较难察觉的实例,当数据非独立同分布,内部存在确定的强关联(但未被留意),此时随机划分测试集与验证集,验证集与测试集间就会存在信息泄露。
注意:对于某些时序预测,如股市价格,若每日价格波动有限(限制涨跌),则当天价格就会是次日价格的很好估计,因此即便价格预测准确率很高,对于交易而言可能也并无帮助。对于后者能准确预测每日涨跌及幅度的模型才是有价值的,因此更合理的预测目标是每日的价格波动,而非价格本身。
Data Visualization
1
2
3
4
5
6
7
8
9
10
11
12
13
14
15
16
17
18
19
20
21
import pandas as pdpd.plotting.register_matplotlib_converters() import matplotlib.pyplot as plt%matplotlib inline import seaborn as snsdata = pd.read_csv(data_filepath, index_col="Date" , parse_dates=True ) sns.lineplot(data=data) sns.barplot(data=data.col.to_frame().T) sns.heatmap(data=data, annot=True ) sns.scatterplot(x='col1' , y='col2' , hue='col3' , data=data) sns.regplot(x='col1' , y='col2' , data=data) sns.lmplot(x='col1' , y='col2' , hue='col3' , data=data) sns.swarmplot(x='col1' , y='col2' , data=data) sns.histplot(data, x='col' ) sns.kdeplot(data.col) sns.jointplot(x='col1' , y='col2' , data=data, kind='kde' )
1
2
3
4
5
6
7
8
9
10
11
12
13
14
15
16
17
18
19
20
21
22
import pandas as pdimport plotly.express as pxpx.line(data) px.bar(data.col) px.imshow(data, text_auto=True ) px.scatter(data, x='col1' , y='col2' , color='col3' ) px.scatter(data, x='col1' , y='col2' , trendline='ols' ) px.scatter(data, x='col1' , y='col2' , color='col3' , trendline='ols' ) px.strip(data, x='col1' , y='col2' ) px.histogram(data, x='col' ) px.density_contour(data, x="col1" , y="col2" , marginal_x="histogram" , marginal_y="histogram" ) import plotly.figure_factory as ffff.create_distplot(hist_data=[data.col], group_labels=['col' ], show_hist=False , show_rug=False )
Feature Engineering
关键特征识别(互信息)、新特征引入、高基数类别特征处理(目标编码)、聚类特征(K-means)、(PCA)scikit-learn文档
特征工程就是通过综合现有特征信息,通过特征的变换或降维等改善模型:
提升模型预测表现
减少数据量/计算量
提升结果可解释性
如体感温度就是综合了温度、湿度、风力等信息的指标,可以更好的传递人们主观的温度感受。而机器学习模型需要学习特征变量与目标变量的依赖关系,当模型不能有效学习的关系时,可以通过特征变换加以调整。比如利用线性模型处理非线性依赖问题时,就可通过特征变换使新的特征与目标呈现线性关系。最后,进行特征工程时,基于原始数据的基准模型有助于我们判断新引入的特征是否有效。
特征工程的常见技术有:
数据清洗 :数据缺失、重复、偏置等异常情况特征编码:
特征选择:对数据的已有特征进行重要性排序,剔除不重要的特征
特征变换:基于现有特征的组合变换构建新特征
特征提取:聚类分析
数据降维 :将数据投影到低维空间,并保持数据的核心特性(Embedding)
特征分割、组合稀疏类
特征选择
过滤式(Filter method):使用模型无关的统计指标对特征排序筛选(Filter)mutual_info_classif, mutual_info_regression)、 Pearson相关系数(r_regression)、卡方检验(chi2)、F检验(f_classif, f_regression)等。而相应的选择策略有简单的指定数量(KBest)/百分比(Percentile)及指定显著性水平(计算p值)的Fpr, Fdr, Fwe等。
封装式(Wrapper method):对学习模型进行封装(Wrapper)用于特征评价筛选SequentialFeatureSelector, SFS),反复训练模型并交叉验证,更具体解释可参考西瓜书。此外也可尝试遗传算法等启发式搜索。feature_importances_)或权重(coef_)逐个移除,被称为递归特征消除(Recursive Feature Elimination, RFE),可结合交叉验证(CV)自动确定最佳特征数RFECV。当前特征数为m的模型,k折交叉验证,SFS删除特征需m*k次训练,而RFE只需一次训练(RFECV要k次),但相对的它需要模型提供coef_, feature_importances_或其他特征评价函数。
嵌入式(Embedded method):特征选择直接内嵌(Embedded)在学习模型内SelectFromModel),将得到的特征用于训练其他更复杂的模型。
过滤式特征选择不依赖预测模型,通常速度更快,且所选择特征更为通用,避免过拟合,但也可能错过适合模型的最佳特征,降低模型表现。此外,如果特征筛选指标只考虑特征与预测目标间关联,而未考虑特征间关联,可能最终得到的特征存在冗余关联。特征排序除了直接筛选特征,也可结合交叉验证确定最佳特征数,或者作为封装式筛选方法的初步筛选。封装式特征选择依赖于学习模型,能够自动处理特征间的关联,但需要反复训练和检验模型,计算量更大,此外结果也易出现过拟合。大致而言,过滤式、嵌入式、封装式,在计算量上依次增加,但由于针对性的调校,在效果上通常也依次提升。
https://zhuanlan.zhihu.com/p/67475635 https://zhuanlan.zhihu.com/p/68259539
Data Cleaning
Explainability
Time Series
Geography
EDA
SQL

